mapboxGL
说明
Mapbox GL JS是一个使用WebGL渲染交互式矢量瓦片地图和栅格瓦片地图的JavaScript库,性能高,能够渲染大量的地图要素,拥有流畅的交互以及动画效果、可以显示立体地图并且支持移动端。
1. 引用
与Openlayers和leaflet一样,MapboxGL的引入方式也有两种。一种是通过script和link标签。
html
<link href="…/mapbox-gl.css" rel="stylesheet" />
<script src="…/mapbox-gl.js"></script>
另一种通用是npm的方式引入。
js
npm i mapbox-gl -S
import 'mapbox-gl/dist/mapbox-gl.css';
import mapboxgl from 'mapbox-gl';
// or "const mapboxgl = require('mapbox-gl');"
2. 核心类
mapboxGL的核心类如下图: 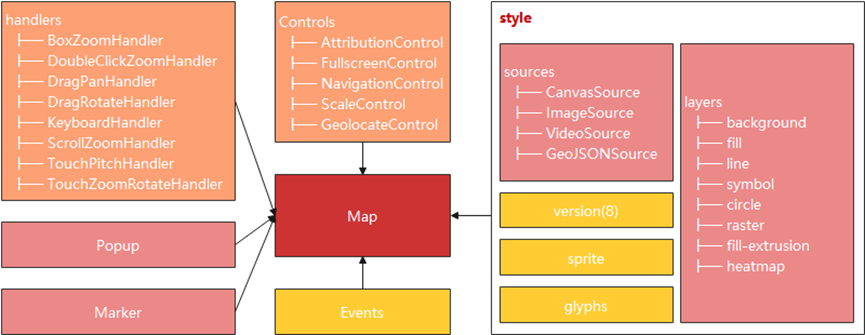
2.1 Map
Map对象代表了在页面上展示的地图,它暴露出了方法和属性供你通过程序控制地图,也绑定了事件可以和地图进行交互。通过一个特定的容器和其他的参数创建一个地图。
js
var map = new mapboxgl.Map({
    container: 'map',
    maxZoom: 18,
    minZoom: 0,
    zoom: 7.4,
    center: {lng: 113.484, lat: 20.9368},
    style: mapStyle,
    attributionControl: false
})
2.2 Style
Style是map初始化的一个配置,在MapboxGL中是一个非常核心的配置参数,它可以是一个JSON数据或文件,其包含了样式版本、样式名称、sources、layers等,其包含内容如下图所示。 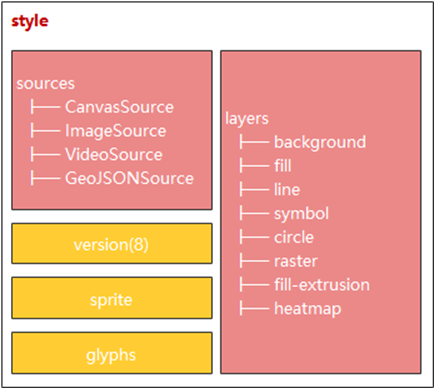 示例样式内容如下。
json
{
    "version": 8,
    "name": "Dark",
    "sources": {
        "mapbox": {
            "type": "vector",
            "url": "mapbox://mapbox.mapbox-streets-v6"
        }
    },
    "sprite": "mapbox://sprites/mapbox/dark-v9",
    "glyphs": "mapbox://fonts/mapbox/{fontstack}/{range}.pbf",
    "layers": [
        {
            "id": "background",
            "type": "background",
            "paint": {
                "background-color": "#fff"
            }
        }
    ]
}
2.3 Source
MapboxGL中的source,可根据类型将其分为vector、raster、raster-dem、image、canvas、video六种,其相关配置如下图。 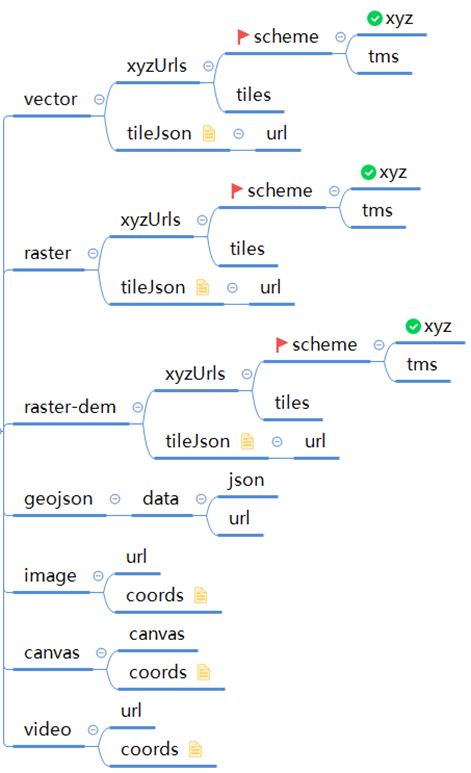
2.4 Layer
MapboxGL中的Layer有10种:background、circle、line、fill、symbol、raster、fill-extrusion、heatmap、hillshade、sky。Layer的添加也有两种方式:写进style、或调用map.addLayer(layer)。示例代码如下。
js
map.addLayer({
    id: 'points',
    type: 'circle',
    source: 'points',
    paint: {
        'circle-color': '#ff0000',
        'circle-radius': 3,
        'circle-stroke-width': 0
    }
})
2.5 Control
MapboxGL中地图控件包括AttributionControl、FullscreenControl、NavigationControl、ScaleControl、GeolocateControl。
2.6 Popup
地图弹窗,其创建方法如下。
js
new Popup(options: Object?)示例代码如下。
js
const markerHeight = 50;
const markerRadius = 10;
const linearOffset = 25;
const popupOffsets = {
    'top': [0, 0],
    'top-left': [0, 0],
    'top-right': [0, 0],
    'bottom': [0, -markerHeight],
    'bottom-left': [linearOffset, (markerHeight - markerRadius + linearOffset) * -1],
    'bottom-right': [-linearOffset, (markerHeight - markerRadius + linearOffset) * -1],
    'left': [markerRadius, (markerHeight - markerRadius) * -1],
    'right': [-markerRadius, (markerHeight - markerRadius) * -1]
};
const popup = new mapboxgl.Popup({offset: popupOffsets, className: 'my-class'})
    .setLngLat(e.lngLat)
    .setHTML("<h1>Hello World!</h1>")
    .setMaxWidth("300px")
    .addTo(map);